Training logistic regression model...
How to Use
- Upload your CSV dataset
- Specify the target variable
- Select problem type
- Choose regularization
- Click "Run Classification"
- Example Downlaod
Key Features
Why choose our Logistic Regression Classifier?
Binary & Multiclass
Supports both binary classification (yes/no) and multiclass problems using One-vs-Rest strategy.
Probability Output
Get probability estimates between 0 and 1 for each prediction, not just class labels.
Feature Importance
Understand which features most influence your model's predictions with coefficient analysis.
Regularization
L1 (Lasso) and L2 (Ridge) regularization to prevent overfitting and improve generalization.
Fast Performance
Optimized implementation that works quickly even with moderately large datasets.
Visualizations
Interactive charts including ROC curves, confusion matrices, and decision boundaries.
The Sigmoid Function
Logistic regression uses the sigmoid function to map predictions to probabilities:
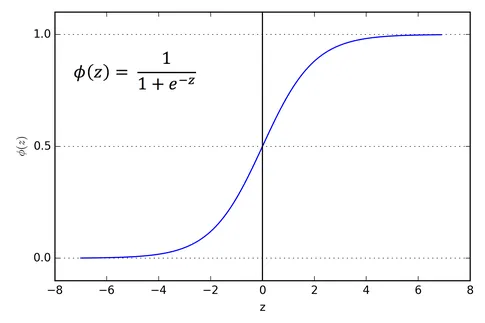
The sigmoid function outputs values between 0 and 1, which we interpret as probabilities:
σ(z) = 1 / (1 + e^(-z))
Decision Boundary
Logistic regression finds a linear decision boundary that best separates your classes:

Training Process
- Initialize: Start with random weights for each feature
- Calculate Probabilities: Apply sigmoid to weighted sum of features
- Compute Cost: Measure how far predictions are from actual values
- Update Weights: Adjust weights to minimize cost (using gradient descent)
- Repeat: Continue until convergence or max iterations
Key Advantages
- Interpretable: Coefficients show feature importance
- Efficient: Fast to train even on large datasets
- Probabilistic: Outputs meaningful probabilities
- Regularization: Built-in protection against overfitting
When to Use
- Binary classification problems
- When you need probability estimates
- When interpretability is important
- With linearly separable data
Frequently Asked Questions
Find answers to common questions about logistic regression
- Positive coefficient: As the predictor increases, the probability of the outcome increases
- Negative coefficient: As the predictor increases, the probability decreases
- Magnitude: Larger absolute values mean stronger effects
- Non-linear relationships: Logistic regression assumes a linear relationship between predictors and log-odds
- Correlated features: Multicollinearity can make coefficients unreliable
- Outliers: Extreme values can disproportionately influence the model
- Imbalanced classes: When one class is much more frequent than the other
- Overfitting: Especially with many features relative to samples
- One-vs-Rest (OvR): Train one classifier per class, with that class as positive and all others as negative. For prediction, choose the class with the highest probability.
- Multinomial (Softmax): A single model that directly outputs probabilities for each class using the softmax function, which generalizes the sigmoid to multiple classes.
- Compare against a baseline (like always predicting the majority class)
- For balanced binary problems, accuracy above 70-75% is often reasonable
- For imbalanced data, consider precision, recall, or F1 score instead
- In medical diagnostics, even 90% might be unacceptable
- For spam detection, 95%+ is often achievable
Common Use Cases
Where logistic regression shines in real-world applications

Spam Detection
Classify emails as spam or not spam based on content features like keywords, sender info, and formatting.

Credit Scoring
Predict whether a loan applicant will default based on income, credit history, and other financial factors.

Disease Prediction
Assess patient risk for diseases based on symptoms, test results, and medical history.

Customer Churn
Predict which customers are likely to cancel subscriptions or stop using a service.